EyeSuite glaucoma analysis

Viewing glaucoma from different angles

Trend Analysis

Identification of change

Following the guidelines of the International Glaucoma Societies, Octopus perimeters calculate the rate of change of MD in dB/year. For a meaningful interpretation of results, unreliable tests can be excluded from the analysis using a simple click on the respective visual field.

Global Trend

Distinguish between overall and local change

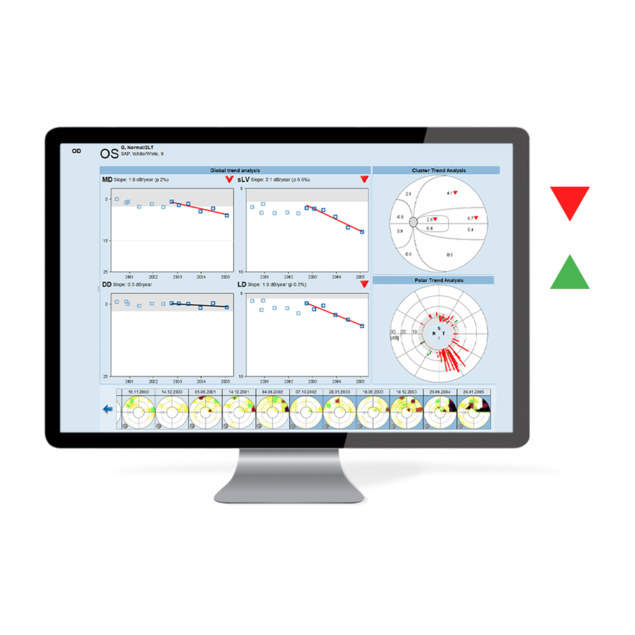
The global trend view shows whether a visual field series is overall stable or progressing using the index Mean Defect (MD). Further, the indices Diffuse Defect (DD) and Local Defect (LD) are helpful, when diffuse loss (due to e.g. a cataract or general visual field unreliability) masks small glaucomatous local changes. The significance of the trend is displayed with icons.

Cluster Analysis/Trend

Sensitive glaucoma analysis

The sensitive Cluster Trend groups visual field defects along nerve fiber bundles and combines high sensitivity with good specificity to detect early glaucomatous changes. Significant cluster worsening is highlighted with red downward arrows. Cluster Analysis is available in both single field and trend view.*


*PMID: 8250069, 24892507, 2871558
Polar Analysis/Trend

For structural comparisons

Combining the results of structure and function is key to obtaining a comprehensive assessment of the onset and progression of glaucoma. The Octopus Polar Analysis projects local visual field defects along the nerve fibers to the optic disc and displays them oriented as structural results. Polar Analysis is available in single field and trend view.

ONH Projection Analysis/ Trend

For structural comparison with OCT segments

The Optic Nerve Head ONH Projection Analysis combines the sensitivity of the Cluster Analysis with the display of the Polar Analysis for structure-function correlations.

Visual field change on one screen

Progression single eye

With the global progression analysis for a single eye, you can look at all relevant progression data of one eye on a single screen. This display includes the global trend view of the four indices MD, sLV, DD and LD, as well as the Cluster and Polar Trend Analysis. For a meaningful interpretation of results, unreliable tests can be excluded from the analysis by a simple click on the respective visual field.
Identification of overall change

Global progression both eyes

The global progression analysis for both eyes shows the trend analysis of the four global indices Mean Defect MD, sLV, Diffuse Defect DD and Local Defect LD. Red downward arrows show significant change at the two significance levels p <5% (unfilled red arrow) and p < 1% (filled red arrow), while the slope indicates the rate of change in dB per year to identify fast progressors. By just looking at the symbols and the slope, visual field progression assessment can be completed in an appropriated time.
Sensitive glaucoma analysis

Cluster Trend Analysis

The Cluster Trend Analysis is sensitive to detect small local glaucomatous changes. It groups visual field defects along nerve fiber bundles in ten visual field clusters. Red downward arrows show significant cluster change at the two significance levels p <5% (unfilled red arrow) and p < 1% (filled red arrow). The rate of change per cluster in dB per years is shown inside each cluster to detect rapidly progressing clusters.
For structural comparisons

Polar Trend Analysis

The Polar Trend Analysis shows single point worsening in the same orientation as a structural result. Red lines indicate the amount of worsening over the selected period.
For structural comparison with OCT segments

ONH Projection Trend Analysis

The Optic Nerve Head (ONH) Projection Analysis combines the sensitivity of the Cluster Analysis with the display of the Polar Analysis for structure-function correlations. All the data is equivalent to that displayed in the Cluster Trend Analysis but shown as OCT segments. Interpretation is made simple: just look for a correlation at the same location in an OCT segment to confirm progression.
arrow-right
arrow-left
Visual field change on one screen
Identification of overall change
Sensitive glaucoma analysis
For structural comparisons
For structural comparison with OCT segments